Shannon entropy across writing systems
Background
Shannon’s 1951 paper estimated the entropy and redundancy of English by measuring how predictable each character is given the characters that precede it (Shannon, 1951). Entropy is the average information per character. Redundancy is the share of that capacity used for structural patterns rather than new content.
This project extends Shannon’s approach using KenLM, a modern n-gram language-modeling toolkit, and applies it to several English corpora, the European languages in the Europarl corpus, and Linear B (an ancient Mycenaean Greek syllabary). The point of comparison is the redundancy that each writing system actually exhibits, across language families and across the alphabet/syllabary split.
Methodology
The pipeline has four steps. Each step is applied identically to every corpus.
Corpus preparation
- Language-specific character filtering.
- Diacritic and special-character handling.
- Unicode handling for Linear B (U+10000 to U+100FF).
- Deduplication and cleaning.
Language model
KenLM 8-gram models with modified Kneser-Ney smoothing. Both ARPA and binary formats are retained for downstream use.
Entropy measures
Four entropy measures at increasing levels of context dependency.
Zero-order entropy (H_0) is the theoretical maximum if all characters were equally likely:
H_0 = \log_2(N)
where N is the number of unique characters.
First-order entropy (H_1) uses the actual character frequencies:
H_1 = -\sum_{i=1}^N p_i \log_2(p_i)
where p_i is the probability of character i. H_1 \leq H_0, with equality only when characters are equiprobable.
Collision entropy (H_2) accounts for character pair frequencies:
H_2 = -\log_2 \sum_{i=1}^N p_i^2
H_2 \leq H_1. The gap is the predictability gained from pairs.
Third-order entropy (H_3) uses the KenLM model to capture longer-range dependencies:
H_3 = -\frac{1}{T}\sum_{i=1}^T \log_2 P(x_i|x_{i-k},\ldots,x_{i-1})
where the conditional probability P is calculated using Kneser-Ney smoothing:
P_{KN}(w_i|w_{i-n+1}^{i-1}) = \frac{\max(c(w_{i-n+1}^i) - D, 0)}{\sum_w c(w_{i-n+1}^{i-1}w)} + \lambda(w_{i-n+1}^{i-1})P_{KN}(w_i|w_{i-n+2}^{i-1})
The ordering H_0 \geq H_1 \geq H_2 \geq H_3 holds across every corpus in the sample. Each successive measure captures more of the predictability available in longer sequences.
Redundancy
Redundancy is the share of H_0 removed by structural pattern:
\text{Redundancy} = (1 - H_3 / H_0) \times 100
A higher value indicates more predictable character sequences.
Results
European languages
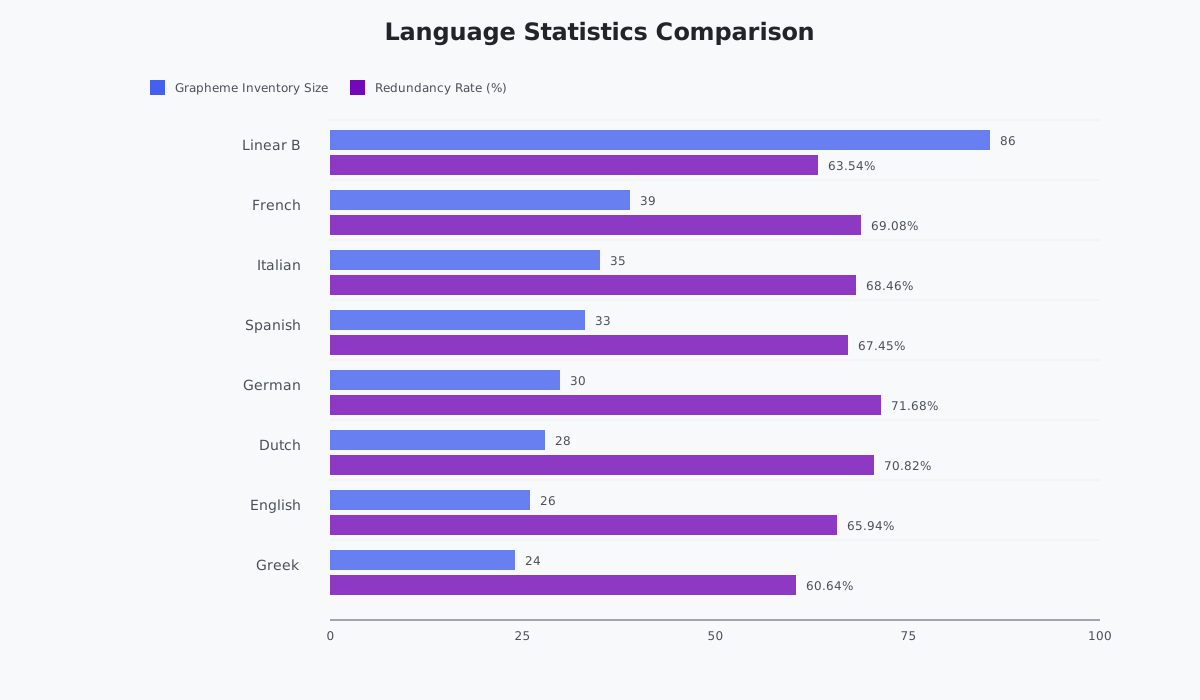
| Language | Grapheme Inventory | H_0 | H_1 | H_2 | H_3 | Redundancy |
|---|---|---|---|---|---|---|
| Linear B | 86 | 6.43 | 5.74 | 5.46 | 2.34 | 63.54% |
| English (Europarl) | 26 | 4.70 | 4.14 | 3.89 | 1.60 | 65.94% |
| French | 39 | 5.29 | 4.13 | 3.85 | 1.63 | 69.08% |
| German | 30 | 4.91 | 4.17 | 3.78 | 1.39 | 71.68% |
| Italian | 35 | 5.13 | 4.02 | 3.76 | 1.62 | 68.46% |
| Greek | 24 | 4.58 | 4.16 | 3.96 | 1.80 | 60.64% |
| Spanish | 33 | 5.04 | 4.14 | 3.85 | 1.64 | 67.45% |
| Dutch | 28 | 4.81 | 4.09 | 3.70 | 1.40 | 70.82% |
English corpora
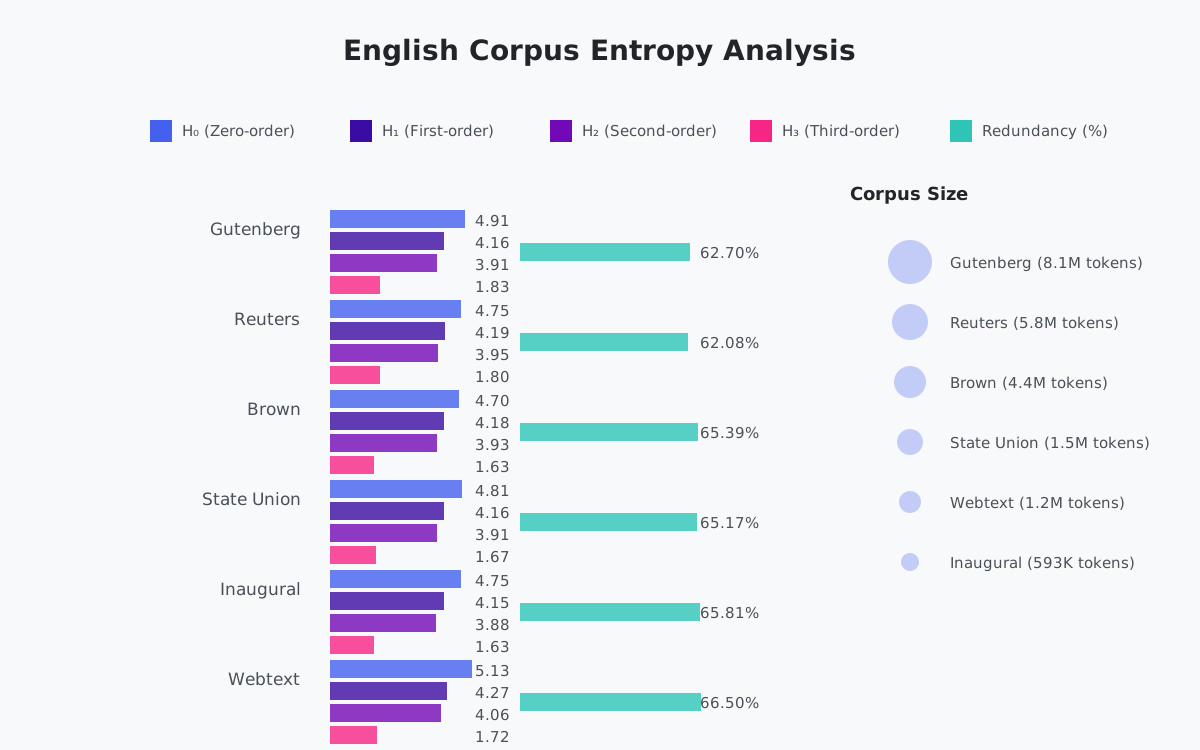
| Corpus | Token Count | Vocab Count | H_0 | H_1 | H_2 | H_3 | Redundancy |
|---|---|---|---|---|---|---|---|
| Brown | 4,369,721 | 46,018 | 4.70 | 4.18 | 3.93 | 1.63 | 65.39% |
| Reuters | 5,845,812 | 28,835 | 4.75 | 4.19 | 3.95 | 1.80 | 62.08% |
| Webtext | 1,193,886 | 16,303 | 5.13 | 4.27 | 4.06 | 1.72 | 66.50% |
| Inaugural | 593,092 | 9,155 | 4.75 | 4.15 | 3.88 | 1.63 | 65.81% |
| State Union | 1,524,983 | 12,233 | 4.81 | 4.16 | 3.91 | 1.67 | 65.17% |
| Gutenberg | 8,123,136 | 41,350 | 4.91 | 4.16 | 3.91 | 1.83 | 62.70% |
Analysis
Germanic languages
German (71.68%) and Dutch (70.82%) show the highest redundancy in the sample. The drop from H_0 to H_3 is steepest in these two languages. The pattern is consistent with orthographies that rely on a relatively small set of well-formed character combinations.
Romance languages
French, Italian, and Spanish cluster between 65% and 69%. The shared Latin substrate and broadly phonemic orthographies are consistent with this clustering.
Modern Greek
Greek shows the lowest redundancy in the sample (60.64%), paired with the smallest grapheme inventory (24 characters). A small inventory combined with low redundancy is consistent with relatively even character use rather than heavy positional or sequence constraints.
Linear B
Linear B is a syllabary of 86 graphemes. Its H_0 (6.43) reflects the inventory size, not its redundancy. Its redundancy (63.54%) sits in the same range as the alphabetic systems in the sample. The syllabary/alphabet distinction does not, by itself, produce a different redundancy profile in these data.
Alphabetic systems
Across alphabetic languages, H_0 ranges from 4.58 to 5.29 and redundancy from 60% to 72%. The variation indicates that inventory size and redundancy are partially independent. A small inventory does not force high redundancy, and a larger inventory does not force low redundancy.
Conclusion
Redundancy across the writing systems in this sample clusters between 60% and 72%, with most cases in a narrower 63% to 68% band, close to two-thirds. The clustering holds across language families and across the syllabary/alphabet split.
Two observations follow. First, the writing systems considered here do not span the full range of mathematically possible redundancy rates; they occupy a narrow band. Second, that band is robust to the writing-system distinctions usually treated as primary, including inventory size and syllabary or alphabet status. The data do not establish a universal optimum, but they do bound where attested systems actually sit.
References
Citation
@online{winstead2024,
  author = {Winstead, John},
  title = {Shannon Entropy Across Writing Systems},
  date = {2024-10-01},
  url = {https://jhnwnstd.github.io/research/shannon-entropy/},
  langid = {en}
}